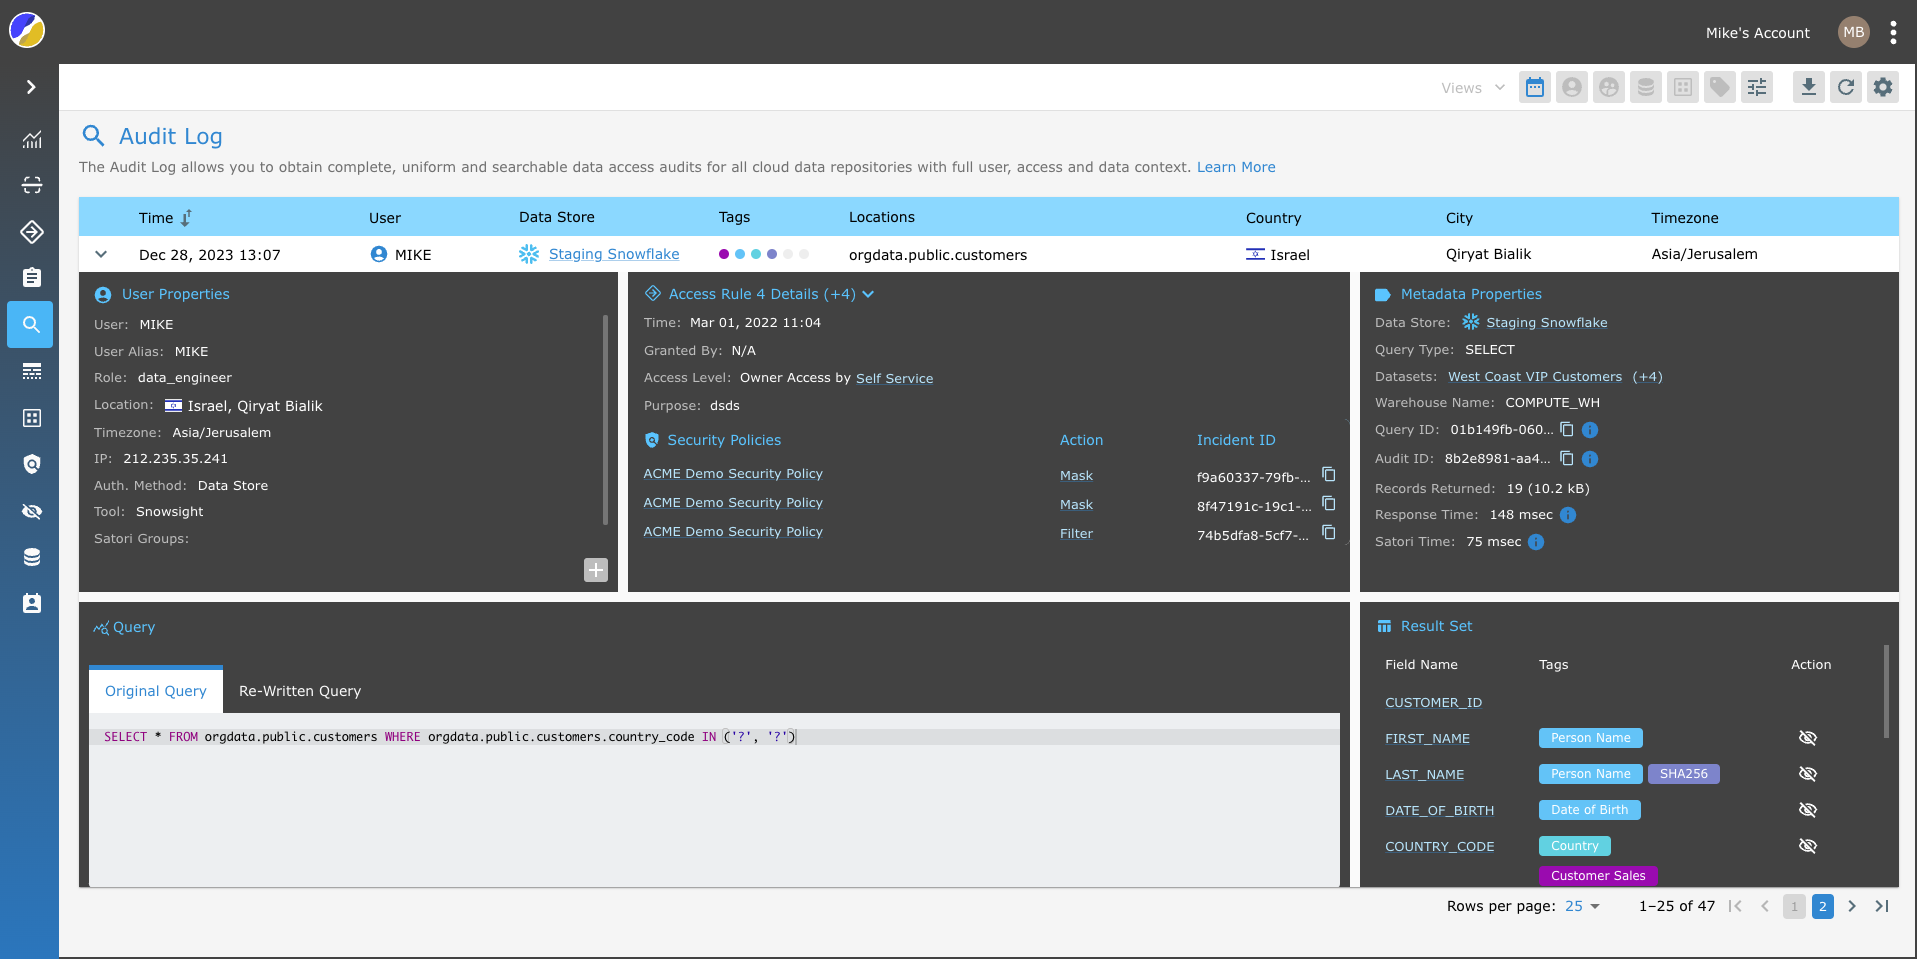
Audit Log
The Audit Log allows you to obtain complete, uniform and searchable data access audits for all cloud data repositories with full user, access and data context.
Your audit data is retained in your account indefinitely and there is no retention or roll-off window for the data. On the audit page, you can query up to 90 days of audit data at a time.
You can monitor data access, generate compliance reports, investigate incidents and conduct access reviews for all data stores from the Satori management console.
Audit Log Functionality
The Audit Log provides you with the following capabilities:
- Search and Filter - See a list of available filters below
- Export and Download as a CSV file - Download the complete report of the audit log for offline analysis or compliance.
- Share - Generates a URL that can be sent to other users of the account in the Satori management console to view the report.
- Columns Filter - Click on the settings icon on the top right corner of the filter toolbar and select which columns to show in the table.
- Show/Hide Administrative Queries - When using client tools such as an IDE or a BI tool, not all queries sent by the tool are driven from the user using the tool. For example, the tool may send multiple queries to read the schema of the data store.
To filter these "administrative queries" out and focus on queries sent by users, click on the Settings icon on the top right corner of the filter toolbar and use the toggle button.
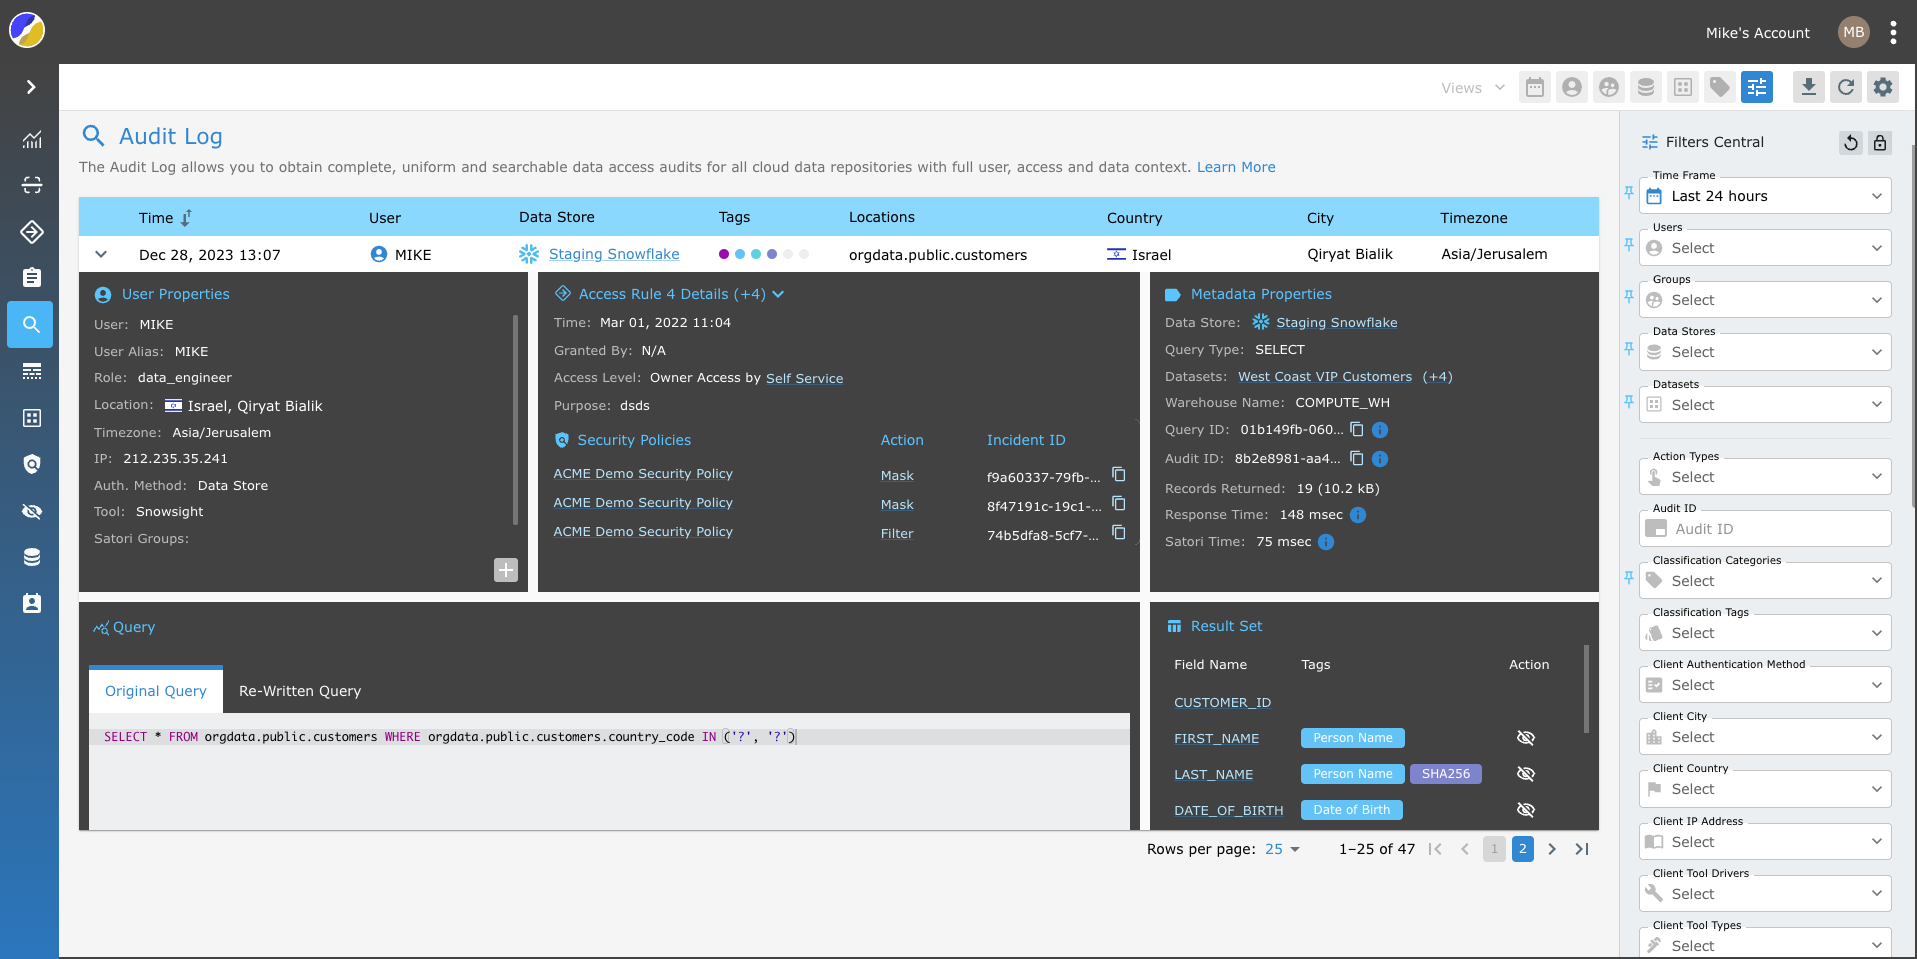
Filters Central
Satori provides you with a powerful range of filter controls to view and understand your data. The following list describes some of the available filter options in the Audit Log.
- Time Frame - Displays the queries that were sent in the specified time frame.
- Data Store - Displays the queries that were sent to a particular data store.
- User Name - Displays the queries that were executed by a particular user.
- Role - Displays the queries that were executed using a particular role or IdP group.
- Client Tool - Displays the queries that were sent from a particular client tool. The complete list of client tools is available from the following link. Client tools List.
- Data Store Location - Displays the queries that accessed a specific table or column.
- Tags - Search for queries by tag. For a complete list of the available tags in Satori, go to Tag Reference.
- Incidents - Displays the queries that generated an incident
- Incident ID - Search by specific incident IDs
Action Types
There are several query action types available. These actions determine how Satori handles the query or query result.
No Action Taken - The query that was sent did not trigger any security policy.
Query Allowed - The query triggered a security policy and did not enforce any action on the query.
Query Alert - The query triggered a security policy and raised an alert.
Query Result Masked - The query triggered a security policy and applied a masking profile on the result.
Query Blocked - The query triggered a security policy and was blocked. The query was not sent to the data store.
Query Result Filtered - The query triggered a security policy and the query result was filtered.
Query Result Blocked - The query result triggered a security policy and was blocked. The query was sent to the data store.
For more information about action types go to the Action section of the Custom Policy Engine chapter.
Defining Filter Favorites
Easily add your favorite filters to the toolbar by clicking the pin icon located to the left of each filter in the Filter Panel.
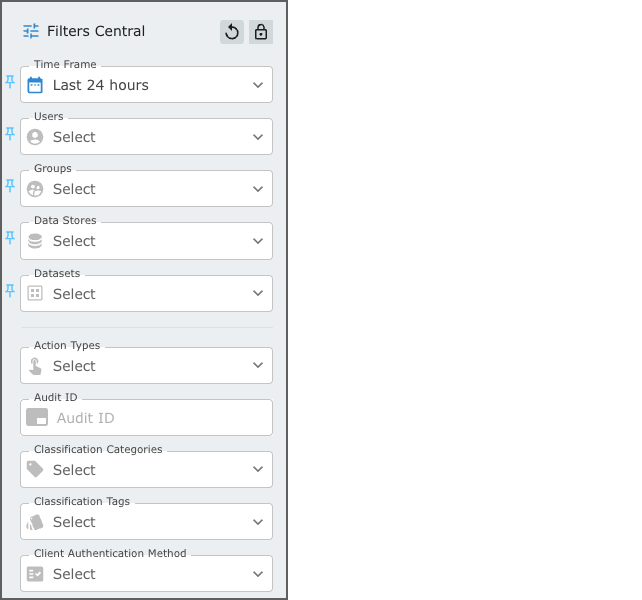
Hover over the filters in the Filter Panel and click on the Pin icon that appears on hover to the left of each filter. You can add a maximum of six filters to the toolbar.