Monitoring Satori
The Satori DAC is a mission critical part of your infrastructure and should be monitored to proactively identify any reliability issues.
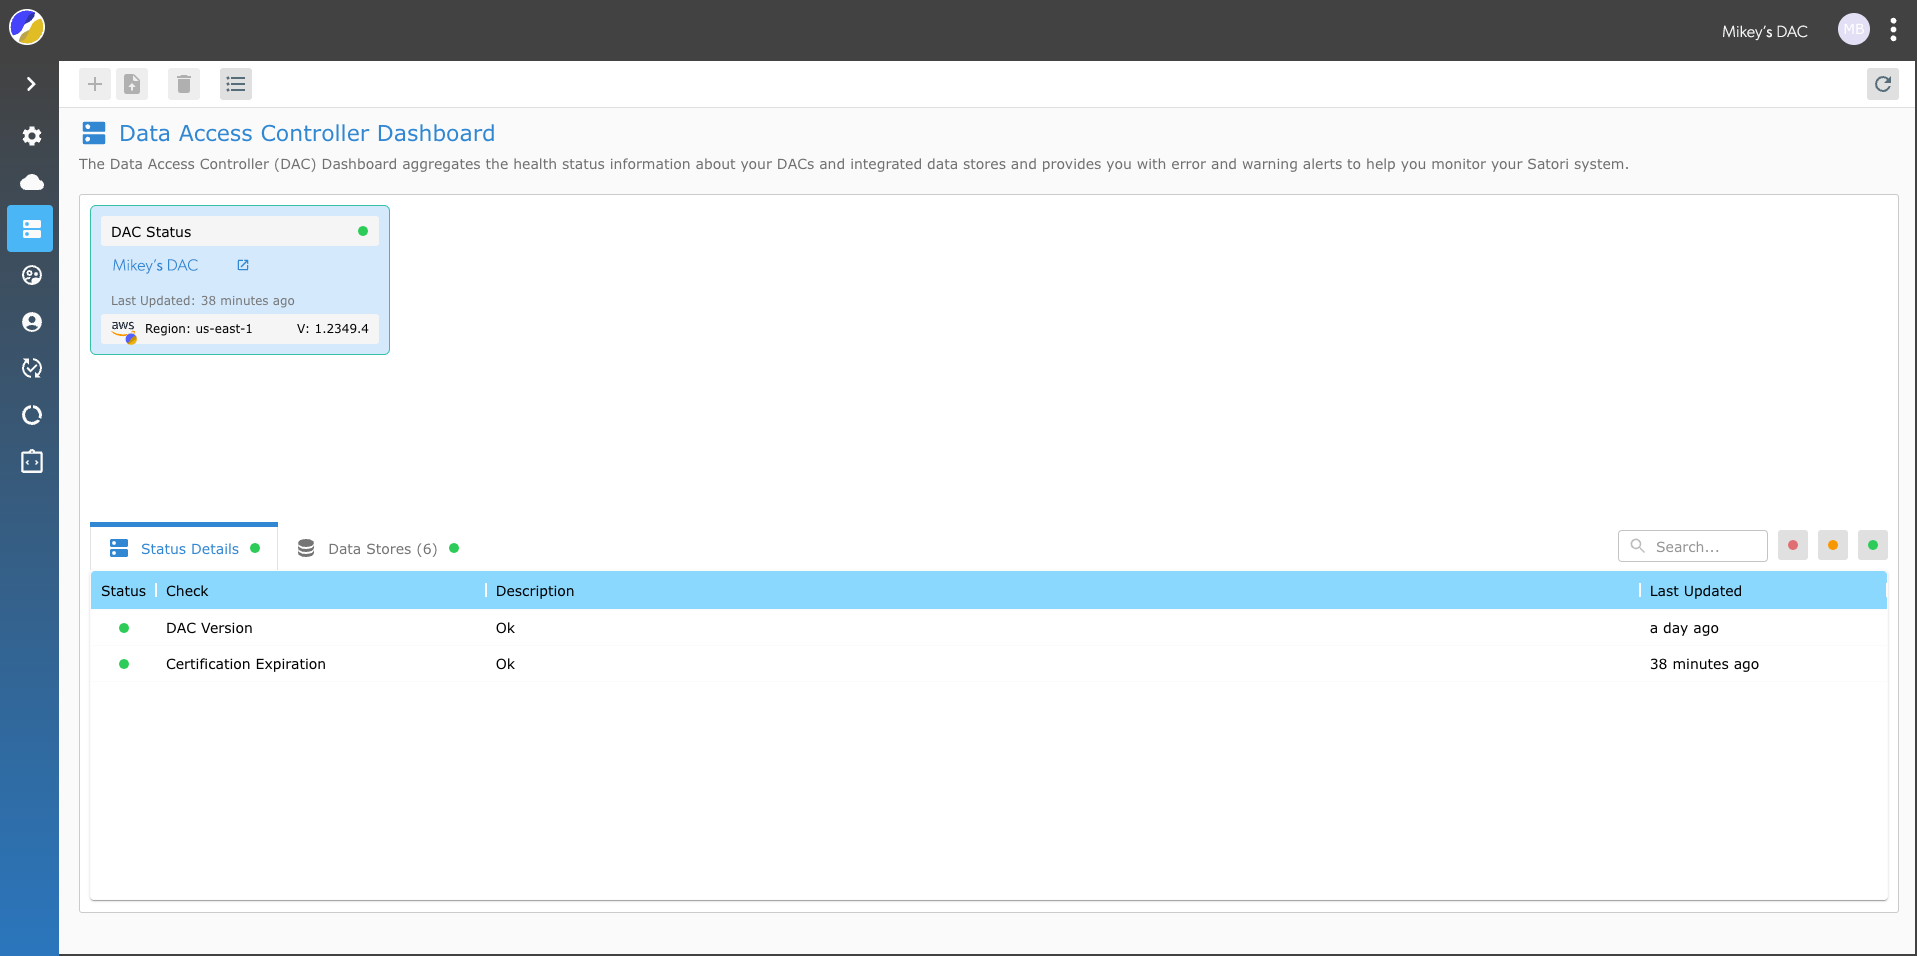
DAC Dashboard
Satori now provides you with an easy way to monitor and track your deployed DAC. The deployed DACs appear as tiles at the top of the screen and show the DAC version, status (Public certificate validity and version). The DAC status is updated periodically.
DAC Monitoring Indicators
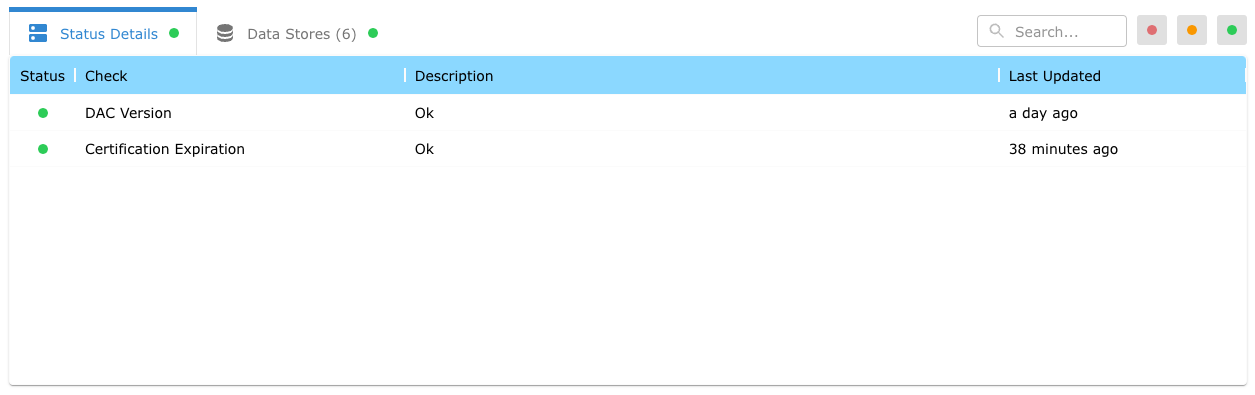
Currently, we provide support for two basic indicators:
- DAC Version - The DAC version status led turns orange when the DAC version is older than three weeks and turns red when it's older that seven weeks. (Satori recommends that you update your DAC periodically to ensure that you have the latest version with all of the available functionality).
- Certificate Expiration - The expiration date status led turns orange when there is less than two weeks remaining on the certificate and red when there is less than week left until expiration.
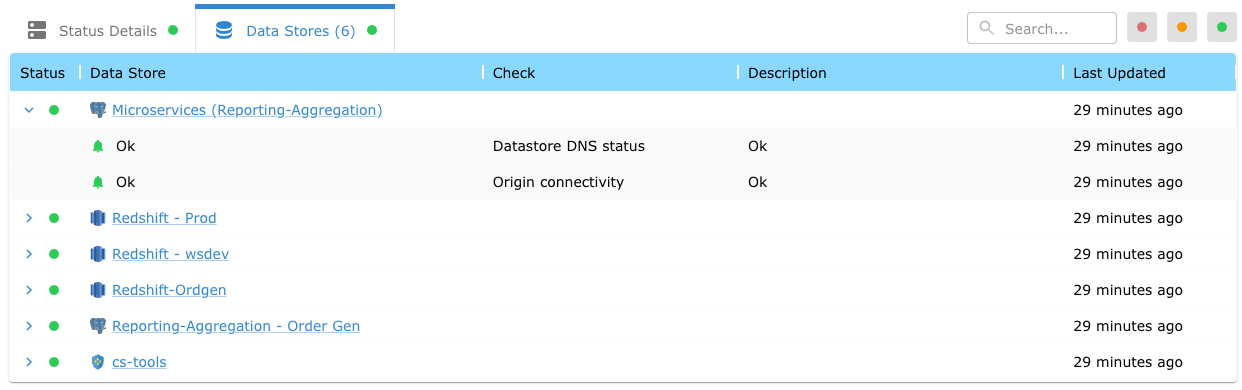
In addition, Satori exposes the Data Stores that are associated with the selected DAC instance. The Data Stores currently support two indicators:
- DNS Status - is derived by validating the generated Satori hostname associated with the data store.
- Origin Connectivity - is derived by validating the origin hostname associated with the data store.
Shared Responsibility Operational Model
The Satori customer-hosted deployment operational model is a shared responsibility model: all aspects of infrastructure, kubernetes control plane, cluster resources and health should be maintained and monitored by the customer.
Satori Product Health Metrics
The Satori deployment has a built-in prometheus service for reporting the health metrics to Satori. This service alerts Satori any applicative health issues.
When an alert is triggered it is handled proactively by the Satori team and in cooperation with the customer, when required.
NOTE: The Satori support team is available to assist with all technical issues.
Click here to read more about Support.
Monitoring your Cluster - Best Practices
The build-in prometheus service provides you with a basic understanding of the cluster health based on the applicative metrics. To improve the overall monitoring of your Satori DAC, Satori recommends that the service is monitored on multiple levels. Each level exposes a different view of the system, together they provide a wholistic understanding of the current health of the DAC.
Infrastructure Monitoring
Monitoring the DAC infrastructure proactively identifies issues preventing the deployed software from running smoothly.
NOTE: Infrastructure monitoring is environment specific and beyond the scope of this guide.
Black Box Monitoring
Black box monitoring provides a clear indication of DAC health as experienced by data consumers. Satori provides an out-of-the-box reference solution for monitoring your DAC by periodically querying your Satori Datastores.
The reference implementation is provisioned via Terraform on AWS and includes a periodic Lambda function which runs a simple query on a dataset in your DAC to checking liveness.
For additional information visit the DAC tools repo
Application Monitoring
Metrics scraped by the built-in prometheus service may be scraped in parallel by the monitoring service deployed in your environment.
Scraping DAC metrics using Prometheus:
The DAC components expose metrics that are scraped based on the standard kubernetes annotations (Learn more here):
annotations:
  prometheus.io/path: "<path>"
  prometheus.io/port: "<port>"
  prometheus.io/scrape: "true"
Prometheus service discovery is used to scrape the metrics (more on this topic here).
Scraping DAC metrics using additional tools:
You can integrate any monitoring tool for scraping and ingesting metrics from the DAC. If custom pod annotations are required, please contact the Satori support team.
Highlighted DAC metrics:
Notable applicative metrics which can be monitored by scraping the DAC pods, this list may change from time to time as additional metrics are added:
| Name | Type | Description |
|---|---|---|
| ACTIVE_CONNECTIONS | Gauge, Info | Active TCP connections |
| bypassed_connections | Counter, Error | Connection in bypass mode (no policy/access enforcement) |
| coredumps | Counter, Error | Detected core dumps |
| failed_custom_certificate_error_total | Counter, Error | Failure to load custom certificate |
| gcp_pubsub_publish_error | Counter, Error | Management console communication failure |
| panic | Counter, Error | Analyzer panic (green thread malfunction) |